Goleta, CA, September 25, 2019 – Bubbleology Research International published a layman’s summary of recently published journal article, “Validation of mobile in situ measurements of dairy husbandry emissions by fusion of airborne/surface remote sensing with seasonal context from the Chino Dairy Complex.” Common language descriptions of important science findings – like the article below – give everyone access to science regardless of their education background. The general summary published in Atlas of Science is mirrored below and can be found directly at this link: https://atlasofscience.org/trace-gas-emissions-from-husbandry-by-combining-satellite-airborne-and-surface-observations/
Trace gas emissions from husbandry by combining satellite airborne and surface observations
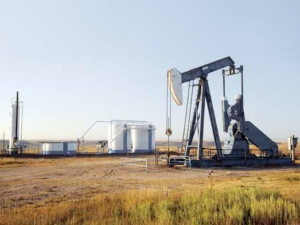
Animal husbandry produces the potent greenhouse gas, methane, which traps heat in the atmosphere (like carbon dioxide). This industry also produces ammonia, which leads to particle (smog) formation that’s dangerous when breathed and affects sunlight and thus climate. However, the amounts released are uncertain because emissions vary with husbandry practices that differ between seasons, dairies, and regions. Real-world studies are needed but too few are available.
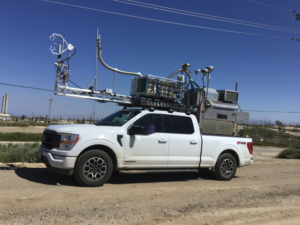
We studied the Chino Dairy Complex because of its isolation from other dairies and ammonia sources in the largely urban Los Angeles Basin. Data were collected on scales from regional to single buildings on a single dairy by AMOG Surveyor – a mobile air quality and meteorology lab that measures while driving at up to highway speeds. With AMOG was MISTIR, which measured the atmospheric ammonia column (how much ammonia from the ground to space). Flying in support was Mako, an airborne imaging spectrometer that mapped how much ammonia there was over the entire region. Finally, the IASI satellite brought scope and context from 9 years of observations of the Los Angeles Basin. IASI data were segregated by month to determine the seasonal variability.
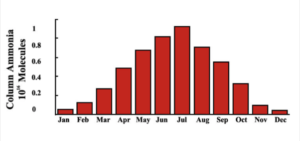
Fig. 1. Monthly average measurements of trace gas emissions by the IASI satellite. The pyramid shape formed by the graph in ammonia column concentration displays the seasonal trend.
This study’s primary finding was that the seasonal variability – 900% for ammonia – was much larger than reported in other ammonia husbandry studies by a factor of three or more. The study proposed this arose from legacy emissions – today’s dairy emissions include today’s cows and cow waste from years and decades past. Supporting this conclusion was that in recent decades, Chino urbanization has converted many dairies to housing. The Mako ammonia map (Fig. 2) clearly shows diffuse ammonia sources from housing developments to the southeast of Chino but not housing to the northwest that never were dairies. The diffuse legacy plume that Mako saw, was validated by AMOG data (shown) and MISTIR data (not shown).
Fine scale observations also revealed the importance of husbandry practices – such as waste management techniques – on trace gas emissions. AMOG measurements were taken around individual dairies and thus observed varying levels of emissions coming from different areas of the dairy complex. Real world studies – like the present one – can reflect the influence of practices on emissions. The emissions created by a dairy full of cows is not simply the trace gas output per cow multiplied by the number of cows at a facility. More concentrated, large-scale dairies produce a multiplication factor of emissions. For example, a denser dairy will allow piles of manure to pile up, preventing drying of the manure which ceases gas emissions.
Emissions from cow waste are still released years later because high temperatures and irrigation/precipitation enable a more rapid release of trace gases. These processes also affect legacy emissions, with changing conditions affecting the amount of ammonia released into the atmosphere
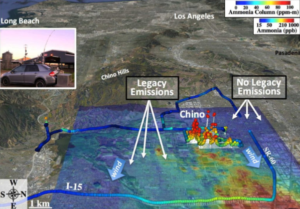
Fig. 2. This map shows Mako airborne data (the coloring on the map’s surface) and verification of those findings with AMOG data (colored circular pins). The upper left hand corner contains a picture of the AMOG Surveyor.
The findings of this paper reveal a significant underestimate in emission budgets for dairies. As of now, when dairies and their lands are converted to other use, their emissions are counted as zero in inventories – no cows, no emissions – but actually continue to release for years or decades. These legacy emissions should be accounted for, otherwise we will continue to be blind to this source of pollution. As more dairies are relocated out of the LA Basin and into agricultural areas, these underestimated emission budgets will become much more of a problem. Not only will the new dairy locations release harmful gases, but the land where the dairy used to be will continue to release for many years to come – and will likely be unaccounted for. These results can drive the industry to improve inventories, budgets and regulation development and enforcement.